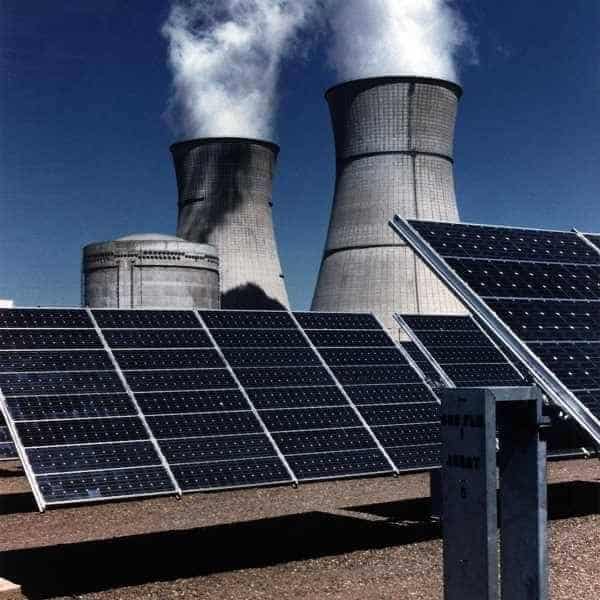
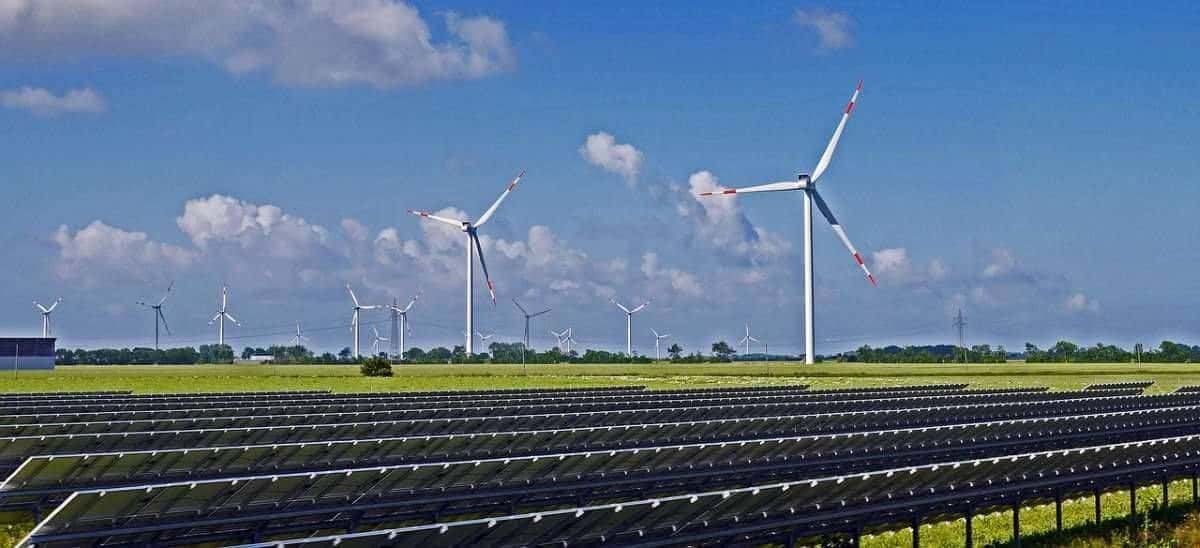
The role of renewable (green) energy is increasing in the U.S.
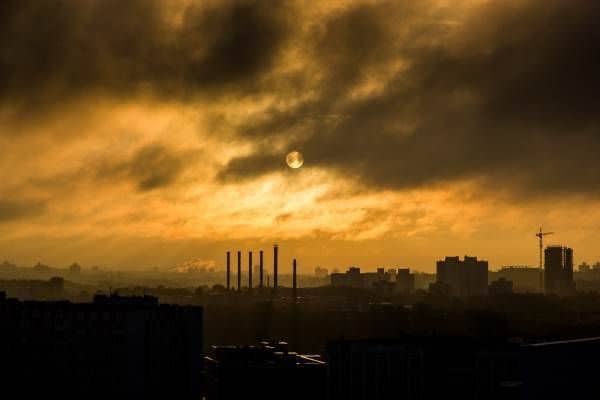
Early U.S. energy consumers replaced the use of wood with coal, petroleum and natural gas in the generation of electricity. Today, the use of renewable energy sources such as solar power, wind power and biofuel is increasing. As a result, the consumption of old, nonrenewable energy sources is declining.
Of all U.S. energy consumption, a total of around 15% was from renewable sources in 2016. That’s roughly a 33% increase over the 10% renewable energy consumption of the previous decade. So at least matters are moving in the right direction.
Surprisingly, the electricity production industry itself consumed around 55% of the renewable energy the U.S. used in 2016. Why? The industry used it to generate electricity for customers.
Approximately 15% of all electricity that industries produced in the country in 2016 was from renewable sources.
Nonrenewable vs. Renewable Energy
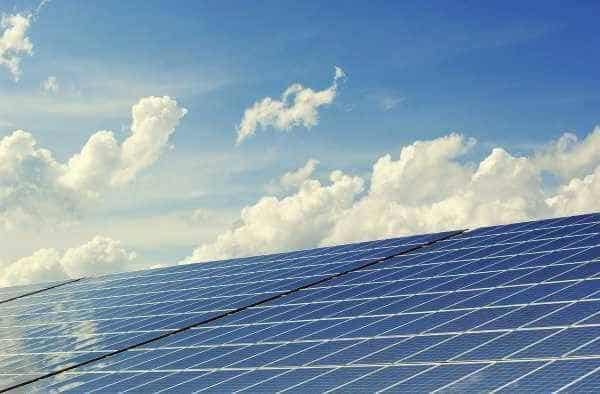
Non-biomass renewable energy sources, such as solar, wind, hydro and geothermal energy, are highly desirable. They don’t emit greenhouse gases directly, but fossil fuels do. Renewables are also unlimited, infinitely available resources (particularly solar and wind).
Moreover, renewables improve local air quality and thus public health. Most renewable production doesn’t damage the land like fossil-fuel extraction does. In many cases (especially with solar and wind), renewable energy production uses little to no water.
Furthermore, lower costs in future years offset the higher up-front costs of switching to renewable energy. The renewable energy industry also creates many more jobs than the fossil fuel industry does. And renewables make the grid more resilient by diversifying energy sources.
For now, renewable energy remains more expensive to generate and use than fossil fuel energy. To reduce these higher costs, state and federal requirements and incentives have helped promote increased renewable energy production. The U.S. Energy Information Administration (EIA) also predicts continuing growth in U.S. renewable energy use through 2040.
Causes of the higher expense associated with renewable energy are often due to simple location issues. Many of the best locations for renewable energy generation are in remote areas, like wind turbines in Texas and California deserts. This makes it comparatively expensive to construct lines to transport electricity from rural sources to areas where most people live.
Additionally, renewable energy sources are not continuously available. For example, clouds reduce production from solar energy electrical power plants. Wind tends to be stronger during certain times of day, which can reduce electricity production from wind farms during peak usage. Extended periods of drought can reduce hydropower production.
So, all our available energy sources, even renewables, have various advantages and disadvantages. Current priorities urge combining multiple sources to transition to a sustainable future for energy consumers. This energy industry model is known as “energy mix.”
Kinds of Energy Sources
Renewable energy sources include the following:
- Solar
- Wind
- Ethanol
- Hydropower
- Geothermal
- Biodiesel
- Landfill gas and biogas
- Solid waste from municipalities
- Biomass (wood and wood debris)
- Marine (harnessed tidal and wave power)
Of all U.S. energy consumption in 2016 (97.4 quadrillion BTU), the use percentages from sources were as follows:
- Petroleum 37%
- Natural gas 29%
- Coal 15%
- Nuclear 9%
Renewable sources accounted for a total of 10%, including the following:
- Hydropower 24%
- Biofuels 22%
- Wind 21%
- Wood 19%
- Solar 6%
- Biomass waste 5%
- Geothermal 2%
Note: The sum may not equal 100% due to rounding individual percentages. (Source: EIA, April 2018 Monthly Energy Review.)
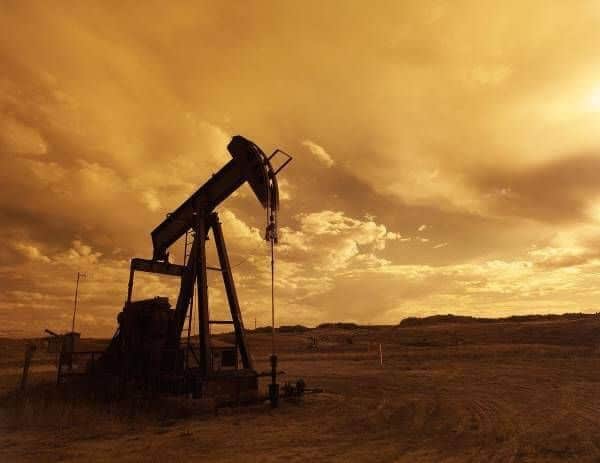
Nonrenewable Energy Sources
Most U.S. electrical power continues to be from petroleum (37%), natural gas (29%) and coal (4%), for a total of 80%. All renewables combined account for only about 20%. Still, from another perspective, 20% is far from the 0% of not so long ago.
Having a full 20% of our power coming from renewable sources is enormous progress. It also speaks very encouragingly of the direction we’re heading as a country. However, we’re moving too slowly per some estimations.
Energy Stability
Building new generating capacities secures a stable energy supply for the future. Plans to ensure a stable energy future for the U.S. benefit the country in multiple ways:
- Improving energy efficiency in homes
- Expanding the development of sustainable resources
- Decreasing reliance on nonrenewable resources
The vast and complex challenges of energy provisioning include the following:
- Resource quantity
- Supply sustainability
- Climate change impacts
- Energy security
- Comparative cost-efficiency
Finding sustainable solutions to these major issues requires a joint commitment among all concerned. Governments, communities and energy providers all must work together toward the common goal of energy stability.
Green Energy Benefits
The use of green energy resources leads everyone toward energy independence on both individual and national levels.
For Individuals
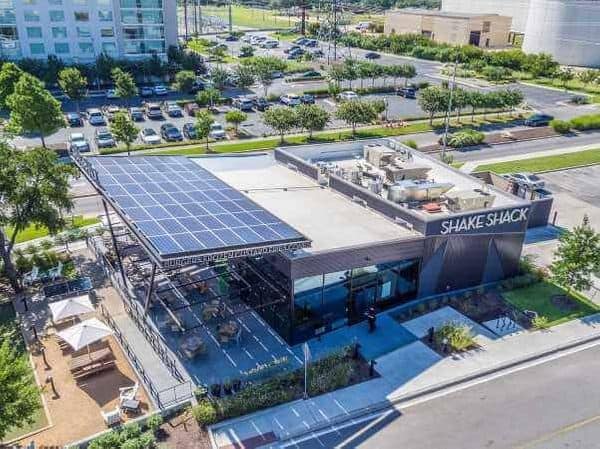
Businesses and homeowners who undertake their own distributed energy generation, becoming their own electrical power providers, reduce their energy costs over time. They can also ensure energy security for their homes and businesses. Plus, they contribute to a greener environment.
For the Country
As the U.S. increases use of domestic solar and other renewable energy sources, it becomes decreasingly dependent on foreign fossil fuel sources. The move toward energy independence prompts better economic and environmental stability for the nation and other countries making the change. It also allows a country to be more flexible in international political interactions.
For the World
With clean energy adoption around the globe, renewable energy frees the world population from reliance on greenhouse gas-emitting fossil fuels. This shift improves economic conditions as well as everyone’s quality of life.
Texas Energy Generation Mix Vs. the U.S.
In Texas, as in most other states (except Oregon and Washington), nonrenewable energy sources continue to outpace renewable sources.
However, there are positive developments in Texas. Scientific American reports that wind energy, which currently accounts for most of Texas’s renewable energy use, totaled nearly 23% of all state-produced power in early 2017. That total is 230% of the 2010 total of only 10%. And it’s a spectacular increase from a mere 3% of renewable sourcing in 2006.
Clearly, Texas power generation has made a significant shift toward renewables over the past 20 years. High economic growth generally leads to poorer air quality where consumers use traditional electricity generation sources. However, using renewables creates economic growth while improving air quality.
In the following information sections, this connection between a healthy economy and local air quality becomes increasingly apparent. Remember that electricity generation sources (like coal, natural gas, nuclear, wind and solar) heavily affect local air quality. Based on current, historical and projected trends, the increasing Texas energy generation mix is on a good trajectory compared with other states.
Texas’s Renewable Energy Future
Some U.S. federal government policies have returned to increasing fossil fuel use. Nonetheless, Texas and other states are speeding ahead on their own to develop renewable energy anyway. And they’re making significant strides.
The largest percentages of power that states produced and used from renewable sources are in Oklahoma, Iowa, Kansas, North Dakota and South Dakota. However, Texas produces the largest quantity of power from renewable sources.
Texas has far surpassed the renewable energy production goals it set in 1999 and those it reset in 2005. In fact, the state currently produces more wind-sourced electrical energy than most countries.
Outside of Austin, Texas, a town called Georgetown has a population of 50,000. Georgetown now sources power entirely from renewable energy. The town made the transition in 2012 because of long-term cost considerations, including the fact that wind offers better price stability than oil and gas over time.
Georgetown stands as a possible forerunner of the future of renewable use by Texas towns. And although Georgetown’s transformation was to all-wind power, it serves as an exceptional indicator of what’s possible concerning a mixed profile of renewables use across the U.S. and the world.
The 2016 report includes progress on these other fronts:
- Wind power provided 50% of the electricity consumers used in multiple Great Plains states, a record high. This high rate of renewable energy use in these states that are leading in renewable usage is due to their strong understanding. In other words, they understand both the environmental and economic benefits of using renewable sources.
- Iowa, another leader in both wind and solar, has vast resources. It sells these resources to its neighbors in Wisconsin and Illinois. Both Wisconsin and Illinois have policies prioritizing the use of renewable energy sources, and that’s created a strong regional clean energy market.
The incomparable scalability of renewables drives energy costs down over time after consumers make the initial investment. More than 90% of the renewable energy production cost is in the building and launching of operations to produce energy. After startup, the renewables-produced fuel is free.
As entities develop more capacity, the per-unit cost of energy production drops, as with any other scalable product. Solar and wind costs are already dropping. Solar is also ready to become the world’s cheapest power source within a few years, even lower than coal, per Bloomberg News.
The total amount of solar energy that entities now produce can meet all the electrical energy needs of 5 million homes. To put that in perspective, consider that about 29 states have population totals below 5 million. Therefore, enough solar power is now produced to provide for all electrical needs of all homes in 29 of 50 U.S. states.
That fact marks excellent progress in solar energy recognition and adoption across the country.
Compensating for Renewable Energy Inconsistency
As we mentioned, one complaint against renewable energy sources is that they can be inconsistent in delivery. Depending entirely on solar or wind places people at risk of insufficient electricity when they need it due to weather. Fortunately, storage technologies have advanced quickly in the past 10 years.
Some states, such as Ohio, Illinois and Pennsylvania, have increased renewable energy storage capacities with batteries that let consumers use power at night or on rainy days. Higher-capacity batteries also make electric vehicles (EVs) and other items more efficient, extending their usability for greater periods between charges.
Power Grid Resiliency
Texas is the only state with its own electricity grid, which the Electric Reliability Council of Texas (ERCOT) operates. So, enhancing utility grid resilience is of special interest to the state.
There are several preferable ways to protect power grids from extreme weather conditions. These conditions include floods, storms and droughts that have become increasingly intense and frequent.
The U.S. electrical grid consists of more than $1 trillion in physical equipment and other property necessary for its function. Protecting such a vast system from threats to services, property, economic health and human life can be very expensive.
As a result, there are key areas of improvement needed to make the U.S. power grid more resilient.
Hardening the Grid
High winds, floods, high heat and other conditions can put grid integrity at risk. Solutions include restoring natural protections along coastlines, relocating essential assets, raising seawalls, installing power lines underground and upgrading aboveground lines.
Securing Distribution Channels
Extreme weather conditions can cause major power outages by increasing demand beyond available resources’ limits. Distribution system damage can also impede countless dependent restoration efforts. California, New York and other states are increasing their numbers of distributed generation (DG) sources. They’re also diversifying renewable fuel types to increase the availability of resources during severe conditions.
Making the Grid Smarter
Smart technologies for rapidly detecting outages and restoring services are essential. They make managing future energy production operations and costs simpler. It’s as important to protect the energy grid’s software as its hardware, perhaps even more so. Smart grid technologies interact with consumer devices, such as internet-controllable appliances and thermostats. This interaction improves system reliability and helps lower customers’ bills.
Distributed Solar Generation
DG involves a range of approaches, including peak power generation by electricity providers, customer-owned generators, combined heat and power (CHP) systems, and micro-grids that serve multiple buildings (e.g., universities, company campuses). Micro-grid and CHP systems can integrate with the grid as parts of its resource mix. Other distributed energy resources (DERs) include small wind turbines, solar photovoltaic (PV) and fuel cells.
A DG system can also include solar battery storage and plug-in EVs, which can significantly affect peak demand curves. Moreover, DG involves wholesale and retail electricity provisions for both regulated and deregulated markets. And Texas, for example, has both.
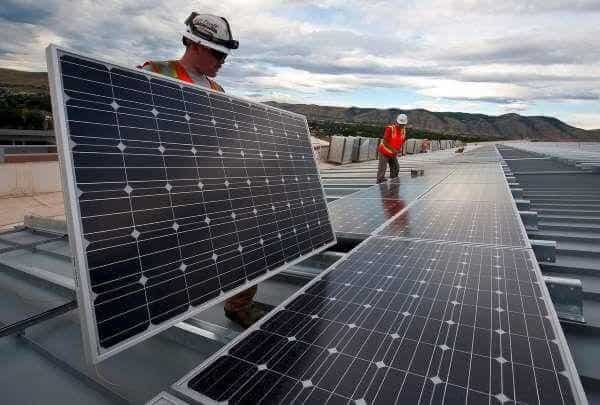
Shifting from traditional electric power systems, utilities and customers are increasingly installing solar DG facilities using small-scale technologies to generate electricity closer to consumers.
Reduced solar panel prices drive this rapid growth, along with state, federal and utility incentives. Residential consumers and businesses receive incentives for solar panel installations, per state renewable portfolio standards (RPS).
Increasing the use of various DG resources can offer multiple benefits:
- Reducing the need for new utility generation assets and services
- Permitting utilities to avoid higher delivery costs by cutting demand during peak periods
- Reducing fossil fuel production pollutants
- Helping make power outages less frequent
However, using a very large amount of DG may present operational challenges for electric companies and customers:
- Excess demand at substations, causing high voltage swings and other stress on electric equipment
- Line worker safety issues
- Difficulty with monitoring and potential impact to load forecast accuracy
- Additional operational complexities for transmission, distribution and generation systems, thus requiring greater capital investments
How to Implement DG
DG means utility companies must meet the challenges of integrating solutions. These include adding combustion turbines to supplement peak power and customer-owned micro-grid and CHP systems, among other elements.
Increased DG may also cause certain broader economic challenges. Under net metering programs, utilities compensate customers for their kilowatt-hour (kWh) contributions to the power grid. Then, utilities charge customers for periods when their grid consumption exceeds their generation, or for the net difference between generation and consumption.
However, some companies haven’t implemented compensation systems that appropriately account for certain fixed charges. This problem may result in financial issues for both customers and providers.
Benefits of DG
Use of DG resources may offer numerous benefits, including avoiding generation capacity costs. For example, DG can reduce development costs for new systems, transmission costs, additional backup power needs and unwanted emissions.
DG Challenges
DG does present operational and economic challenges to electric utilities and their customers. For example, solar DG can only play an important role in meeting energy needs and achieving environmental goals when solar DG customers pay their share of the costs of safe, reliable grid operation.
Ultimately, DG overall can play a very useful role in increasing renewable energy contribution to public power provisioning. However, rate structures again must accurately apportion costs to grid users to ensure its long-term success.
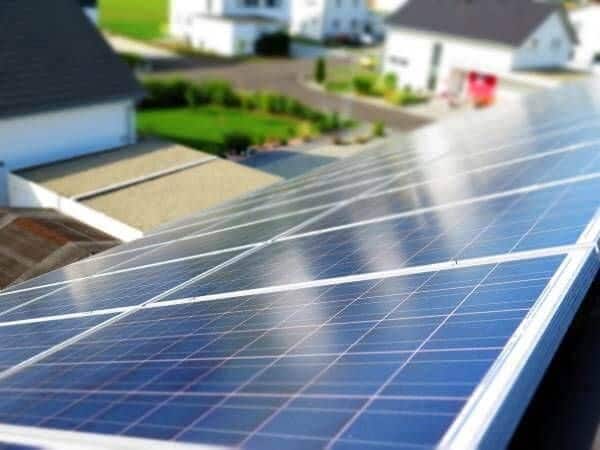
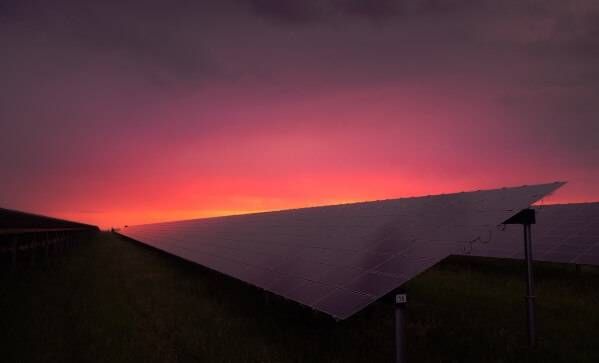
Solar Energy
Solar energy brings independence to individual users. Naturally, seasonal demands increase electricity supplies and delivery costs. That’s because consumers use the infrastructure more heavily, which makes power more valuable to the market.
As a result, unpredictable seasonal energy rate increases can make it nearly impossible for consumers and businesses to budget accurately for energy costs from quarter to quarter.
Businesses and property owners can avoid unexpected rate hikes by investing in on-site distributed energy generation systems. For example, a solar energy system allows property owners to reach partial or complete energy independence. That increases price stability, lowers overall annual energy costs and contributes to a healthier environment.
Plus, cutting grid demand during peak times can lower energy prices for all consumers.
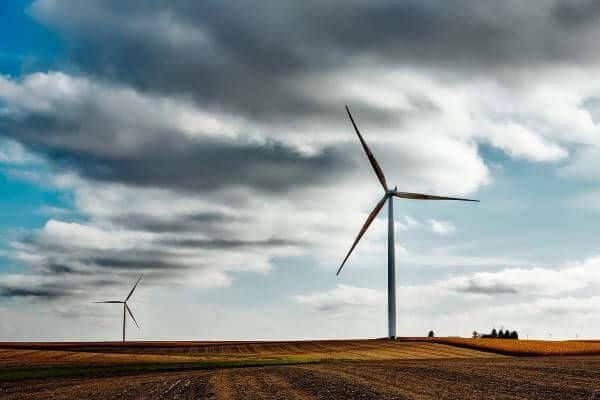
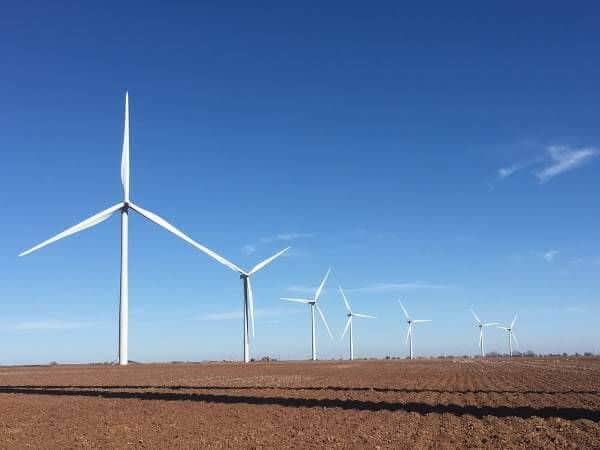
Wind Energy
The U.S. is among the largest and fastest-growing wind markets in the world. The U.S. Department of Energy (DOE) invests in research and development of on- and off-shore wind energy production. These projects create job opportunities, advance technological innovations, spur economic growth, cut carbon fuel pollution and serve other environmental and economic objectives.
Wind energy is among the least expensive of energy supply sources, and costs are still decreasing. The 2016 annual U.S. DOE Wind Technologies Market Report(Lawrence Berkeley National Laboratory) projects U.S. wind energy technologies will remain some of the least expensive for electricity generation. Currently, wind energy production costs around 50% of the operating cost of a natural gas power plant.
Moreover, the price of wind energy has dropped to below $20 per megawatt-hour, or about $0.02 per kWh. Even calculating wind energy economics without factoring in federal wind production tax credits, wind energy is extremely competitive with average wholesale electrical energy prices. In addition, wind turbines are becoming cheaper, larger and generally more cost efficient.
Growth of the Wind Industry
The wind industry continues to compete well against electricity generation from fossil fuels. That competition to increase performance and frequency of wind turbine usability has motivated wind energy producers. As of 2016, the new wind turbine production capacity in the U.S. was an average of 2.15 megawatts (MW), an impressive 11% increase from the previous 5-year average.
Integrating Wind With the Grid
Managing costs of integrating a highly variable electricity source like wind involves resolving storage issues and other concerns. Fortunately, wind energy market penetration has significantly increased, and curtailment of grid integration by operators has decreased.
The decreased curtailment is due to investment in transition and operational modifications to better accommodate wind energy inclusion, per the Berkeley Labs Report. In the ERCOT region, for example, electrical utilities invested $7 billion to link transmission lines between west Texas (a windy region) to central and eastern Texas cities.
Electric Vehicles
EVs provide a compelling path to energy independence. For perspective, most of the country’s natural gas used for electricity generation is domestically produced, compared to what we put in gas tanks. What we use in gas-powered vehicles ties directly to global oil and gas production.
The EV market is among the global economy’s fastest-growing and most dynamic high-tech sectors. It’s also immediately useful for serving intelligent, interactive electricity demand. Consumers bought around 160,000 plug-in EVs last year. That’s enough to supply the entire population of an average U.S. town with an electric car.
Some utility companies are anticipating what they’ll need to absorb the electricity load of charging EVs. The most proactive industry planners will be able to capture many financial and service benefits for customers and the grid. EV charging can integrate to benefit vehicle owners, utility customers, shareholders and society as a whole. If utility providers plan for the load of charging EVs, they can both absorb the load at low cost and yield important benefits across the system.
These benefits include positive economic impacts of using renewable energy and supplying additional services to the grid, including from power factor correction in the case of EVs. Waiting to act will result in continuing emissions from the power grid and a less reliable, stable grid.
In terms of DERs, the vehicle-to-building (V2B) is especially promising. That’s because it provides the capacity to use energy stored in EV batteries to supplement the grid during outages and extreme system loading. In turn, this helps the system meet reliability requirements.

Energy Conservation
Technological advancements are continuing, while Americans are actually using less energy overall. Consumers have reduced their total amount of energy use by 3.6%, even though the population and economy have been growing. In part, the reduction is due to increasingly efficient modern consumer technologies for energy use.
Companies are designing light bulbs, appliances, gadgets, buildings, vehicles and other energy-consuming items for better functionality and no additional energy use.
The expansive benefits of reducing energy waste include substantial cost savings for consumers and industrial users, which is very appealing. Energy conservation also serves the increasingly popular commitment to environmental interests.
Industry-watchers predict the trend in conservation will continue despite the deregulation mode in which top Washington authorities are operating, per LaSalle Investment Management’s March 2018 report. However, some environmentalists are concerned that the reversal in government direction from energy conservation may slow progress.
The Role of Green Jobs
The U.S. Bureau of Labor and Statistics (BLS) states the green employment sector is performing exceptionally well, contrary to other reports.
California, New York, Texas, Pennsylvania, Illinois and Ohio have the highest numbers of green jobs, in that order. Note that the oil and gas sector has a strong presence in most of those states.
Furthermore, a rapidly growing number of companies either produce green products or provide green services. Highlights of the BLS study include the following:
- There are 3.1 million jobs in the U.S. green economy. This is an increase from the 2010 Department of Commerce study that found between 1.8 million and 2.4 million green jobs. Conversely, gas and oil sector jobs are now around 2.2 million, per the API. This reflects the fact that the green economy provides 30% more jobs than the gas and oil industry.
- At almost 500,000 jobs, green manufacturing provides the largest number of jobs of any private sector industry, per the BLS report.
- The annual growth rate of the green energy sector was 8.3% during the study period. That’s nearly twice the growth rate of the entire U.S. economy (2010).
- Median wages for green energy jobs are 13% higher than the national average, and almost 50% of green jobs don’t require a four-year college degree.
- For every $1 million, 16.7 green jobs are created. This is more than triple the 5.3 jobs created per $1 million in fossil fuel industries.
- Most retrofitting products created for clean energy efficiency are over 90% made in the U.S. Therefore, green products are an especially supportive industry for the U.S. worker and economy.
- The U.S. currently enjoys a $1.9 billion positive trade balance with China in solar power and in heating and cooling components. The U.S. solar industry exports components to China. By contrast, the oil industry imported more than $250 billion in petroleum-related products in 2010 alone.
- Of U.S. companies involved in clean energy retrofits, 91% are small businesses with fewer than 20 employees. This makes the green jobs market especially compatible with small business interests.
- Of U.S. clean energy jobs, 41% provide training and career-building opportunities. Additionally, 26% of green jobs are in manufacturing, compared to only 9% of jobs across the traditional U.S. employment market.
Green jobs are among the important benefits of strong investments in the U.S. energy infrastructure. Those investments increase career opportunities while reducing air and water pollution, providing alternatives to foreign oil dependence and allowing more international export of American-made products.
Gain Energy Independence With Freedom Solar Power
At solar panel company Freedom Solar, we provide consultation, installation and monitoring of residential and commercial solar energy systems. Our goal is to help American consumers and communities advance toward cost-efficient energy production and use.
To learn more about renewable energy distribution or solar energy systems for your home solar installation or business, get in touch. Complete our contact form or call us at (800) 504-2337 for a free consultation with a solar energy expert!
Looking to maintain, repair or upgrade your solar system? Our solar repair and maintenance department can help you obtain maximum energy production and efficiency.